
The Federal Reserve agreed with markets but tried to change the narrative
Chief Economist Eugenio J. Alemán discusses current economic conditions.
After more than six months of indicating that it lacked conviction regarding the path of inflation, the Federal Reserve (Fed) seems to have gotten a conviction boost so large that it pushed it to lower the federal funds rate by 50 basis points at the September Federal Open Market Committee (FOMC) meeting. This garnered cheers from markets but also generated the first dissent from a member of the Federal Reserve Board of Governors since 2005, who preferred to start the easing cycle with a more moderate cut of 25 basis points.
The FOMC had a dissent in June of 2022, but it came from the President of the Kansas City Federal Reserve and not from a member of the Board of Governors. The FOMC consists of seven members of the Board of Governors, the President of the Federal Bank of New York and four of the other eleven Regional Federal Bank presidents, who are members on a rotating basis.
We were in the camp of the dissenting Board of Governors member, and we explained our position very clearly in last week’s Weekly Economics. However, as is typically the case, the rest of the FOMC members agreed with markets, which had priced in a 50 basis point cut, although there was very little conviction as markets went from 50 to 25 to 50 again in a matter of days.
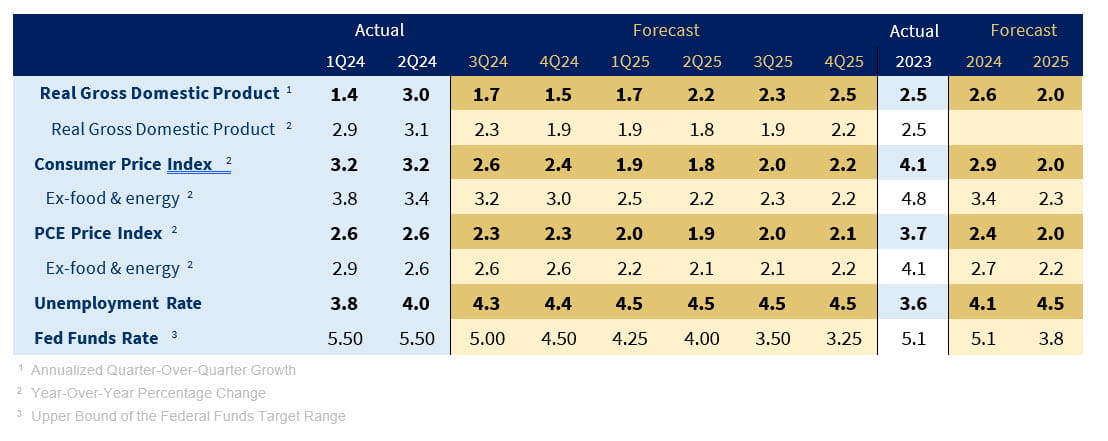
With the new Summary of Economic Projections (SEP), its new dot plot, and the Fed Chairman’s press conference, the message was clear: it is expecting to reduce the federal funds rate, for now, by about 150 more basis points. That is, 50 basis points before the end of this year and 100 basis points for next year. The press conference was all about tempering the market’s worse impulses of expecting more cuts.
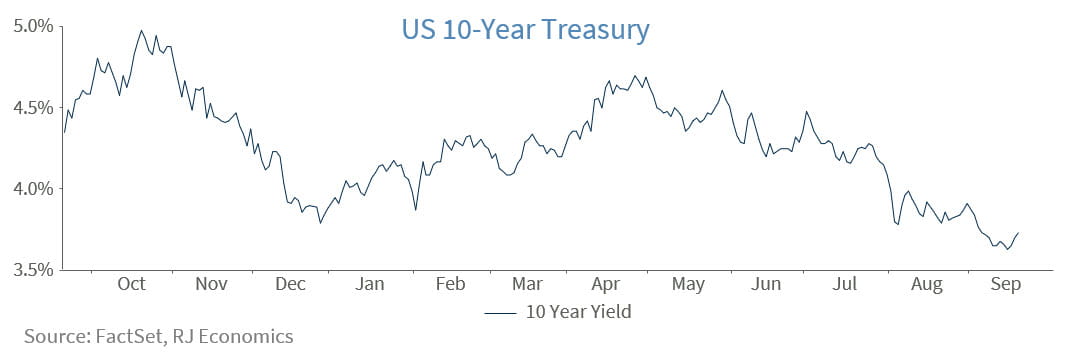
This was the reason why the Chairman of the Fed, Jerome Powell, was very clear in letting markets know that the Fed was not lowering interest rates because it believed the economy was in trouble but because “inflation and the labor market were more in balance” than before and that policy was too restrictive under that environment. That is, the reduction in the yield of the 10-year Treasury until yesterday was due to market fears of an economic recession. However, it seems that the message from Powell was loud and clear and thus we have seen some repricing of bonds after the Fed’s decision as markets recalibrate their view of where the economy is heading.
But this move should be also tempered by what has happened since the March SEP when the Fed expected 75 bps cuts before the end of this year. We argued at the time that its estimates lacked conviction. Then we got the June SEP, in which Fed officials overreacted to the higher than expected inflation numbers during the first quarter of the year and this overreaction sent it to estimate just one, 25 bps, cut before the end of the year. This week’s SEP showed it overreacted once again, but this time it was due to the recent revisions in employment as well as to the increase in the rate of unemployment. Now the Fed is going for 100 bps before the end of the year, of which it has already delivered 50 bps this week.
We could understand June’s overreaction because of the severity of a potential un-anchoring of inflationary expectations but thought that a slow reduction in rates was still the best path forward. However, this week’s decision, despite the market’s positive spin on it, is a clear indication that most members of the FOMC thought that the Fed was behind the curve, otherwise, they would not have given in to market pressures. But markets were putting pressure because they thought that the economy was heading toward a recession. However, the Fed Chairman was clear in arguing that they were not concerned with economic activity and that the reason for lowering the federal funds rate was because monetary policy was too restrictive in an environment where both inflation and employment were more balanced.
While we believe that the economy is better than what markets were expecting, we disagree with the Fed Chairman’s view that the economy is in good shape as he argued during the press conference, and as shown by the SEP numbers. We understand that recessions are fundamentally psychological events, or what John Maynard Keynes called ‘animal spirits.’ (See our Weekly Economics for September 6, 2024), and the Chairman did a good job in trying to change the narrative coming from the markets.
If the Fed is not correct and incoming data disappoints, especially on the employment front, this could contradict the Fed’s rosy picture of the economy. Additionally, if we experience an external shock that changes the highly benign environment for the price of petroleum that we have experienced during the last several months, then the potential fallout could be deeper, triggering a negative psychological reaction that could become a self-fulfilling prophecy.
Changes to our economic forecast:
While consumer demand has softened, control group retail sales continued to grow in August by 0.3%, after a 0.4% increase in July. Most importantly, the Fed has kickstarted its easing cycle by more than we expected, which should lead to lower borrowing costs faster. Lower rates combined with our expectations of subsiding inflation will be supportive of consumer spending over the next two quarters and in 2025. Therefore, we have increased our expectations of economic growth for the third and fourth quarters of this year to 1.7% and 1.5%, respectively. This change has pushed growth for 2024 only slightly higher, from 2.4% to 2.6%, while it did not affect our 2025 forecast, which remains unchanged at 2.0%.
Economic Releases:
Leading Economic Index: The Conference Board’s LEI continued its decline in August, but the majority of components were in positive territory, albeit just barely. The drivers of the overall decline continued to remain the same, as both ISM New Orders and the interest rate spread between 10-year T-bonds and the federal funds rate experienced double-digit declines for the month. The Conference Board expects economic growth to slow in the second half of the year, which is consistent with our view. The Leading Economic Index (LEI) declined a less than expected 0.2% in August after declining by 0.6% in July, according to The Conference Board. FactSet consensus expected a decline of 0.3% during August. According to the release, only four of the ten indicators had negative readings. The Coincident Economic Index (CEI) was up 0.3% in August, with all of the four components of this Index improving during the month. Meanwhile, the Lagging Economic Index (LAG) was unchanged in August after declining 0.1% in July. According to The Conference Board press release for August 2024: “Overall, the LEI continued to signal headwinds to economic growth ahead. The Conference Board expects US real GDP growth to lose momentum in the second half of this year as higher prices, elevated interest rates, and mounting debt erode domestic demand.”
Existing Home Sales: Existing home sales were lower than expected in August while existing home prices have weakened somewhat but remain higher on a year-earlier basis. Weakness in existing home sales was broad-based across the US while home prices were higher in August than a year earlier. The number of months in inventories for existing homes increased in August to 4.2 months compared to 4.1 months the previous month. Although it is clear that existing home prices have weakened, the year-earlier comparison was still positive in August. Thus, the recent decline in mortgage rates is still not enough to have a larger impact on existing home sales. Existing home sales were down by 2.5% in August as well as lower than expected, at a seasonally adjusted annual rate of 3.860 million, compared to an upwardly revised rate of 3.960 million in July, according to the National Association of Realtors (NAR). FactSet expectations were for a 3.900 million annual rate. Compared to a year earlier, existing home sales were down by 4.2%. The Northeast region reported a decline of 2.0% in existing home sales in August compared to July of this year and was flat compared to August of last year. The Midwest reported existing home sales flat in August, month-over-month, but down 5.2% compared to August of last year. The South, which is the largest region in the country, reported a decline of 3.9%, month-over-month, and a 6.0% decline compared to a year earlier. Finally, the West showed a drop of 2.7% versus July and a drop of 1.4% compared to August of last year. The median price of existing homes was $416,700 in August compared to a median price of $404,200 in August of 2023, or a year-over-year increase of 3.7%. The inventory of existing homes for sale stood at
1.350 million in August which, at the current rate of sales represents 4.2 months in supply, up from 4.1 months in supply in July and just 3.3 months of supply a year earlier.
Housing Starts: Housing starts and building permits were higher than expectations in August as single- family starts and permits increased considerably while muti-family housing starts and permits were weak. But probably the most important development in the home construction market is that builders have accelerated completions, which increased by 9.2% in August of this year compared to July but surged by 30.2% compared to August of last year. This is good news for the new home sales market as the inventory of new homes is expected to increase as mortgage rates continue to come down, perhaps helping take some pressure off new home prices. Housing starts increased by a more than expected 9.6% in August, at a seasonally adjusted annual rate of 1.356 million. On a year-earlier basis, housing starts were up 3.9%, according to the US Census Bureau and the US Department of Housing and Urban Development. Single- family housing starts were up 15.8% during August compared to July. By region, housing starts in the Northeast plunged by 27.3% month-over-month in August while declining by 7.9% on a year-earlier basis. However, the decline in housing starts was for multi-family housing starts as single-family housing starts surged by 47.4% in August compared to July and were up by 52.7% compared to August of last year. In the Midwest, housing starts surged by 29.6% in August compared to July and by 28.0% compared to August of last year. Both multi-family housing starts as well as single-family starts were up during the month. In the South, which is the largest region in the country, housing starts increased by 15.5% in August compared to July and by 1.9% on a year-earlier basis. Housing starts for single-family units increased by 18.9% in August, month-over-month, but were down by 6.3% compared to a year earlier. Finally, the West saw housing starts increasing by 5.9%, month-over-month, and by 0.7% year-over-year, with single-unit housing starts increasing by 2.8%, month-over-month, and by 10.7% year-over-year. Building permits were also up, by 4.9% in August compared to July, to a seasonally adjusted annual rate of 1.475 million. On a year-earlier basis, building permits were down by 6.5% in August. Single-family home building permits were up 2.8% in August compared to the previous month. By region, building permits increased by 3.5% in the Northeast, month-over-month, while declining by 8.2% on a year-over-year basis. The Midwest saw permits increase by 12.5%, month-over-month but were down 2.8% year-over-year. In the South, building permits were up 6.0%, month-on-month, but down 2.5% on a year-earlier basis. Finally, in the West, building permits were down 1.6%, month-over-month, and also down, by 17.2%, on a year-earlier basis. Housing completions surged by 9.2%, to a seasonally adjusted annual rate of 1.788 million during August and compared to the previous month. On a year-earlier basis, housing completions were up by 30.2%.
Industrial Production: Industrial production was much higher than expected during August as it rebounded from a large decline during the previous month. At the same time, industrial production was revised down during the period April-June, underscoring the weakness in the US industrial sector. It is also important to note that industrial production numbers are revised considerably month-on-month. The bounce back in August will probably have little effect on the Federal Reserve’s monetary policy decision for this weak as the industrial sector remained flat on a year over year basis. Industrial production was up by 0.8% in August, according to the Federal Reserve after declining by a downwardly revised 0.9% during the month of July. FactSet expectations were for a 0.15% increase. Industrial production was also revised down during the April to June period. On a year-over-year basis, industrial production was flat. By major market groups, the production of final products increased by 0.9%, as consumer goods production increased 0.7% and business equipment surged by 1.4%. Nonindustrial supplies increased by 0.3% while construction also surged by 1.4%. Finally, materials production increased by 0.9% during the month. By major industry groups, the manufacturing sector recovered from a weak performance in July, down 0.7%, to an improvement of 0.9% in August, month-on-month. Manufacturing production was revised down for April, June, and July. Mining production increased by 0.8% while utilities production was flat during the month of August. Capacity utilization for the total industry moved slightly higher, from 77.4 in July to 78.0 in August, while capacity utilization for the manufacturing sector also increased, from 76.6 in July to 77.2 in August.
NAHB/WF Housing Market Index: The NAHB/Wells Fargo Housing Market Index bounced back from its lowest level since December 2023 to a level of 41 in September. Elevated interest rates continued to be the reason for buyer hesitation, but lower mortgage rates on the horizon are pushing all the subindices higher. With the Federal Reserve expected to start easing rates tomorrow, mortgage rates are likely to soften, and therefore we believe this positive trend in the housing market is likely to continue. The NAHB/Wells Fargo Housing Market Index (HMI) came in as expected in September, at 41 compared to an unrevised reading of 39 in August, according to the National Association of Home Builders. The Single-Family Sales: Present increased from 44 in August to 45 in September while the Single-Family Sales: Next 6 Months was higher, at 53 in September compared to a reading of 49 in August. The Traffic of Prospective Buyers was also higher, at 27 in September compared to 25 in August. The regional HMIs were all positive. The Northeast region increased the most from 46 in in August to 55 in September. The Midwest increased from 38 in August to 42 in September, the West region increased from 37 in August to 42 in September, and the South region experienced a slight increase, from 39 in August to 40 in September. According to the NAHB release “the share of builders cutting prices dropped in September for the first time since April, down one point to 32%. Moreover, the average price reduction was 5%, the first time it has been below 6% since July 2022. Meanwhile, the use of sales incentives fell to 61% in September, down from 64% in August.”
Retail Sales: Total Retail and Food Services sales increased more than expected in August, up 0.1% versus expectations for a 0.2% decline. However, we should note that these sales are nominal sales and are thus affected by inflation. Inflation during the month of August was 0.2% so this means that real retail and food services sales were negative in August in real terms. Retail weakness was broad-based with very few exceptions during the month. The best sectors in August were sales at miscellaneous store retailers and at nonstore retailers, i.e., online sales. This report supports our view that consumer demand continues to slow down. Total Retail and Food Services (TR&FS) sales increased by a more than expected 0.1% during the eighth month of the year while July’s print was revised up slightly, from an original increase of 1.0% to 1.1%, according to the US Census Bureau. FactSet expectations called for a decline of 0.2%. On a year- earlier basis, R&FS sales were up 2.1%. Retail Trade (RT) sales were also up 0.1% MoM and 2.0% YoY. TR&FS sales excluding motor vehicle & parts increased by 0.1%, the same rate of growth reported for TR&FS less gasoline stations’ sales. Excluding both motor vehicle sales and gasoline sales, TR&FS sales increased by 0.2%. Motor vehicle & parts dealers’ sales were down by 0.1% while sales at furniture stores were down by 0.7%. Sales at electronics & appliance stores were down by 1.1%. Sales at building material & garden equipment & supplies dealers increased by 0.1%. Sales at food & beverage stores declined by 0.6%. Sales at health & personal care stores was up by 0.7%. Gasoline stations sales declined by 1.2% while sales at clothing & clothing accessories stores declined by 0.7%. The strongest sectors during the month of August were sales at miscellaneous store retailers, up 1.7%, and at nonstore retailers, up 1.4%. Finally, sales at food services & drinking places were flat in August. Control group retail sales, which is a proxy for the calculation of personal consumption expenditures in GDP calculations increased by 0.3% after a 0.4% increase in July.
Economic and market conditions are subject to change.
Opinions are those of Investment Strategy and not necessarily those of Raymond James and are subject to change without notice. The information has been obtained from sources considered to be reliable, but we do not guarantee that the foregoing material is accurate or complete. There is no assurance any of the trends mentioned will continue or forecasts will occur. Last performance may not be indicative of future results.
Consumer Price Index is a measure of inflation compiled by the US Bureau of Labor Statistics. Currencies investing is generally considered speculative because of the significant potential for investment loss. Their markets are likely to be volatile and there may be sharp price fluctuations even during periods when prices overall are rising.
Consumer Sentiment is a consumer confidence index published monthly by the University of Michigan. The index is normalized to have a value of 100 in the first quarter of 1966. Each month at least 500 telephone interviews are conducted of a contiguous United States sample.
Personal Consumption Expenditures Price Index (PCE): The PCE is a measure of the prices that people living in the United States, or those buying on their behalf, pay for goods and services. The change in the PCE price index is known for capturing inflation (or deflation) across a wide range of consumer expenses and reflecting changes in consumer behavior.
The Consumer Confidence Index (CCI) is a survey, administered by The Conference Board, that measures how optimistic or pessimistic consumers are regarding their expected financial situation. Current Situation Index (CSI) and Future Expectations Index (FEI) are the end-results of CCI, covering economic conditions, employment, price, income, and expense. The reading is 100 plus the average of said five factors
Certified Financial Planner Board of Standards Inc. owns the certification marks CFP®, CERTIFIED FINANCIAL PLANNER®, CFP® (with plaque design) and CFP® (with flame design) in the U.S., which it awards to individuals who successfully complete CFP Board's initial and ongoing certification requirements.
Links are being provided for information purposes only. Raymond James is not affiliated with and does not endorse, authorize or sponsor any of the listed websites or their respective sponsors. Raymond James is not responsible for the content of any website or the collection or use of information regarding any website's users and/or members.
GDP Price Index: A measure of inflation in the prices of goods and services produced in the United States. The gross domestic product price index includes the prices of U.S. goods and services exported to other countries. The prices that Americans pay for imports aren't part of this index.
The Conference Board Leading Economic Index: Intended to forecast future economic activity, it is calculated from the values of ten key variables.
The U.S. Dollar Index is an index of the value of the United States dollar relative to a basket of foreign currencies, often referred to as a basket of U.S. trade partners' currencies. The Index goes up when the U.S. dollar gains "strength" when compared to other currencies.
The FHFA House Price Index (FHFA HPI®) is a comprehensive collection of public, freely available house price indexes that measure changes in single-family home values based on data from all 50 states and over 400 American cities that extend back to the mid-1970s.
The Pending Home Sales Index (PHSI) tracks home sales in which a contract has been signed but the sale has not yet closed.
Supplier Deliveries Index: The suppliers' delivery times index from IHS Markit's PMI business surveys captures the extent of supply chain delays in an economy, which in turn acts as a useful barometer of capacity constraints.
Backlog of Orders Index: The Backlog of Orders Index represents the share of orders that businesses have received but have yet to start or finish. An increasing index value usually indicates growth in business but shows that output is below its maximum potential.
Import Price Index: The import price index measure price changes in goods or services purchased from abroad by
U.S. residents (imports) and sold to foreign buyers (exports). The indexes are updated once a month by the Bureau of Labor Statistics (BLS) International Price Program (IPP).
ISM Services PMI Index: The Institute of Supply Management (ISM) Non-Manufacturing Purchasing Managers' Index (PMI) (also known as the ISM Services PMI) report on Business, a composite index is calculated as an indicator of the overall economic condition for the non-manufacturing sector.
Consumer Price Index (CPI) A consumer price index is a price index, the price of a weighted average market basket of consumer goods and services purchased by households.
Producer Price Index: A producer price index (PPI) is a price index that measures the average changes in prices received by domestic producers for their output.
Industrial production: Industrial production is a measure of output of the industrial sector of the economy. The industrial sector includes manufacturing, mining, and utilities. Although these sectors contribute only a small portion of gross domestic product, they are highly sensitive to interest rates and consumer demand.
The NAHB/Wells Fargo Housing Opportunity Index (HOI) for a given area is defined as the share of homes sold in that area that would have been affordable to a family earning the local median income, based on standard mortgage underwriting criteria.
Conference Board Coincident Economic Index: The Composite Index of Coincident Indicators is an index published by the Conference Board that provides a broad-based measurement of current economic conditions, helping economists, investors, and public policymakers to determine which phase of the business cycle the economy is currently experiencing.
Conference Board Lagging Economic Index: The Composite Index of Lagging Indicators is an index published monthly by the Conference Board, used to confirm and assess the direction of the economy's movements over recent months.
New Export Index: The PMI new export orders index allows us to track international demand for a country's goods and services on a timely, monthly, basis.
Durable Goods: Durable goods orders reflect new orders placed with domestic manufacturers for delivery of long- lasting manufactured goods (durable goods) in the near term or future.
Source: FactSet, data as of 9/20/2024
